From Punch Cards to the "Modern Data Stack"
A journey from the origins of computing and data analytics to what we now call the "Modern Data Stack". What comes next?
The Origins of Computing and Data Analytics
The origins of computing and data analytics began in the mid-1950s and started taking shape with the introduction of SQL in 1970:
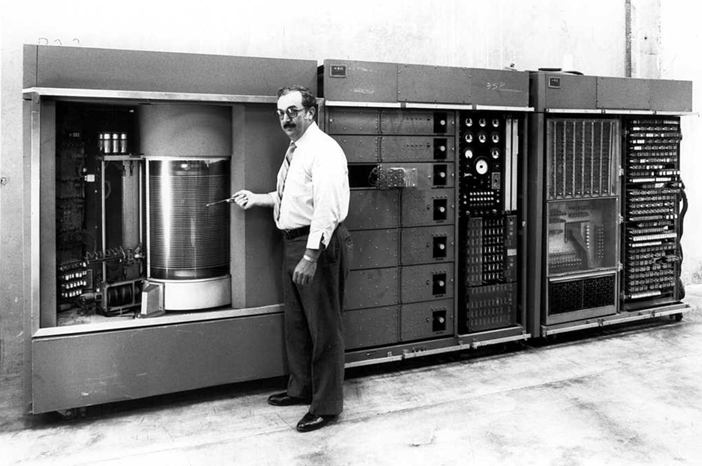
- 1954: Natural Language Processing (NLP) - “Georgetown-IBM experiment”, machine translation of Russian to English
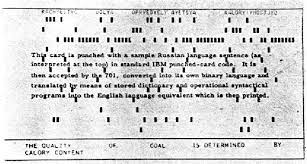
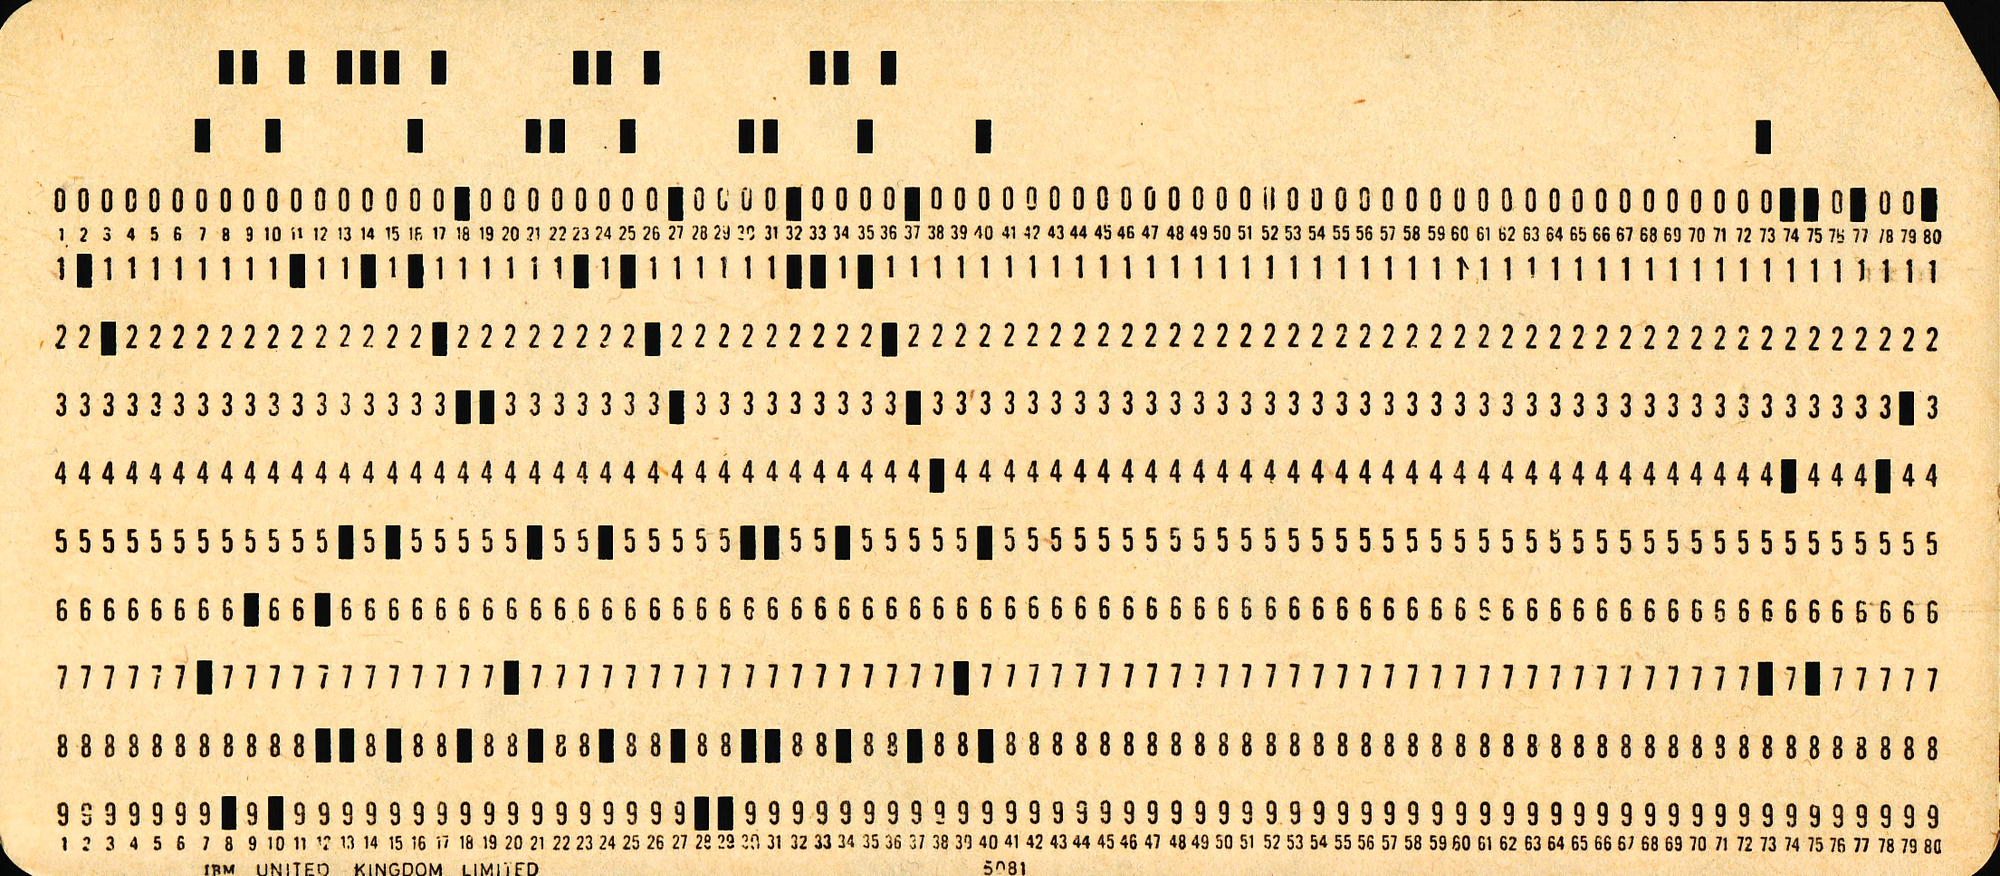
- 1960: Punch Cards
- 1970: Structured Query Language (SQL)
- 1970s: Interactive Financial Planning Systems - Create a language to “allow executives to build models without intermediaries”
- 1972: C, LUNAR - One of the earliest applications of modern computing, a natural language information retrieval system, helped geologists access, compare and evaluate chemical-analysis data on moon rock and soil composition
- 1975: Express - The first Online Analytical Processing (OLAP) system, intended to analyse business data from different points of view
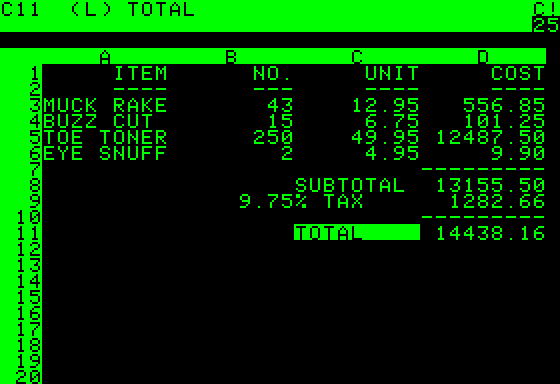
- 1979: VisiCalc - The first spreadsheet computer program
- 1980s: Group Decision Support Systems - “Computerized Collaborative Work System”
The “Modern Data Stack”
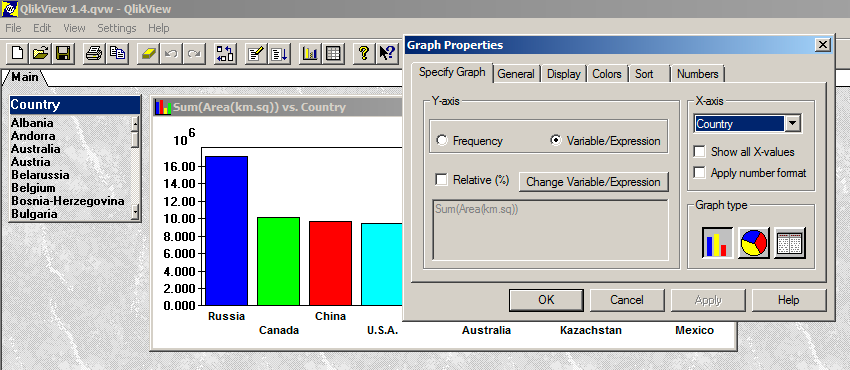
The "Modern Data Stack" is a set of technologies and tools used to collect, store, process, analyse, and visualise data in a well-integrated cloud-based platform. Although QlikView was pre-cloud, it is the earliest example of what most would recognise as an analytics dashboard used by modern platforms like Tableau and PowerBI:
- 1994: QlikView - “Dashboard-driven Analytics”

- 2003: Tableau
- 2009: Wolfram Alpha - “Computational Search Engine”
- 2015: PowerBI
- 2017: ThoughtSpot - “Search-driven Analytics”
Paper, Query Languages, Spreadsheets, Dashboards, Search, what next?
Some of the most innovative analytics applications, at least in terms of user experience, convert human language to some computational output:
- Text-to-SQL: A tale as old as time, LUNAR was first developed in the 70s to help geologists access, compare, and evaluate chemical-analysis data using natural language. Salesforce WikiSQL introduced the first extensive compendium of data built for the text-to-SQL use case but only contained simple SQL queries. The Yale Spider dataset introduced a benchmark for more complex queries, and most recently, BIRD introduced real-world “dirty” queries and efficiency scores to create a proper benchmark for text-to-SQL applications.
- Text-to-Computational-Language: Wolfram Alpha, ThoughtSpot
- Text-to-Code: ChatGPT Advanced Data Analysis
Is "Conversation-Driven Data Analytics" a natural evolution?
- UX of modern analytics interfaces like search and chat are evolving, becoming more intuitive, enabled by NLP and LLMs
- Analytics interfaces have origins in enabling decision-makers, but decision-makers are still largely reliant on data analysts
- Many decision-maker queries are ad-hoc, best suited to “throwaway analytics”
- Insight generation is a creative process where many insights are gained in conversations about data, possibly with peers
- The data analytics workflow is disjointed, from the imagination of analysis to the presentation of results
Acknowledgements
Dates for the section "The Origins of Computing and Data Analytics" thanks to https://web.paristech.com/hs-fs/file-2487731396.pdf and http://dssresources.com/history/dsshistoryv28.html.
